

The drying phase is one of the critical stages of any refractory installation or repair: a single error can destroy all the work carried out. A successful project starts at the engineering stage, which will define the optimum drying curve based on the characteristics of the material, including, among other factors, its thermogravimetric behaviour.
To demonstrate the importance of this first step, we analysed the behaviour of three of our products. They have a similar alumina content, but different binder systems:
- Aluloc 81 SR: Low cement castable
- Alfaston 81: Sol-gel castable
- Fosincast 90: Phosphate-bonded castable
Thermogravimetric Curves
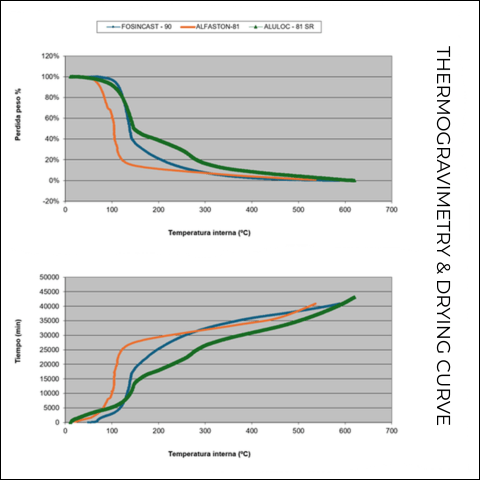
The curves represent the moisture-loss profile of different 80% alumina-based refractory castables with different binder systems as a function of increasing temperature and time under controlled conditions.
The first graph evaluates moisture release as a percentage of weight loss as a function of temperature, while the second graph complements it by showing the thermal kinetics of the process, i.e. how long each material takes to reach a given temperature based on the stabilisation of weight loss.
The combination of both graphs allows technicians to assess the ease or difficulty of removing moisture from the castables during drying processes and, together with many other factors, determine the most appropriate drying curves for each refractory lining.
Material Analysis
- Aluloc 81 SR (green curve)
It starts losing moisture from 110°C and shows clear changes in slope related to the loss of free water and chemically combined water from the cement binder (calcium aluminate phases). At 180°C, it has lost only 45% of its moisture, and at 300°C, 80%. It does not reach 95% water loss until 550°C. The drying process applied to this material must consider moderate gradients until reaching this temperature. It requires longer drying curves in terms of time.
- Alfaston 81 (orange curve)
It shows the earliest dehydration of the three materials, starting between 70°C and reaching 80% moisture loss at 120°C. At 300°C, the material has lost practically 100% of its moisture. This water-loss profile requires strict control of the initial drying ramps below 150°C and allows a faster and more aggressive drying curve from 300°C onwards.
- Fosincast 90 (blue curve)
It starts losing moisture from 100°C and its dehydration is more progressive, showing two inflection points at 150°C and 300°C, at which point it reaches 95% moisture loss. This type of material allows shorter drying curves.
Planning Drying from the Engineering Stage
These two highly informative graphs reflect the importance of taking the product characteristics and its behaviour into account when planning a drying process. Knowing how to interpret the material’s thermogravimetric curve is a very important step, but other factors, such as the lining or installation design, will be decisive for the final outcome of the project.
At Insertec, we understand that no two projects are the same and that successful drying is planned from the engineering stage. For this reason, our specialists analyse all the parameters and challenges of your installation in order to design and implement a unique, safe and effective drying plan.
Because good drying does not only prevent failures: it extends refractory life, reduces production downtime and improves the overall performance of the installation.